I built this site in preparation for the Data Journalism class I’m teaching in Fall 2013 at New York University (SCPS). There’s not much here right now except for a long list of recommended readings and a few technical walkthroughs, plus the class syllabus.
The Fall 2013 class is only five weeks long, but I’ve written about or taught data journalism concepts before and will continue doing so, and I thought smalldatajournalism.com would be a good home for this material, for my students and for everyone else.
I currently have a lot of essays and code projects in various stages of completion and hope to add them as I complete them, now that I’m done building the site structure for now. You can see updates to sDJ on the blog. Or follow me on Twitter – @dancow – or the Github repo for updates.
Table of contents
- Introduction
- The smaller the data, the bigger the story
- Journalism that counts
- About the author
- Technical details
- About NYU Data Journalism
Introduction
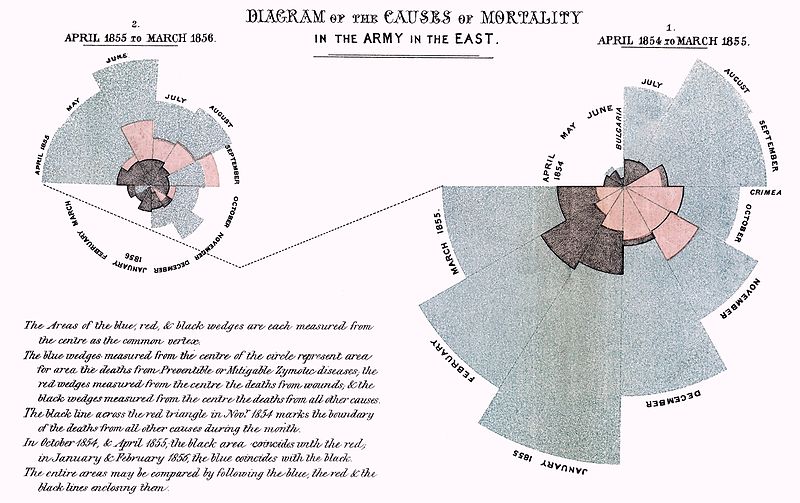
Data journalism goes back decades – centuries if you include the works of Dr. John Snow and Florence Nightingale – and with the rise of personal and cloud computing, and the Web, data journalism has left its niche status and become one of
Or, in the words of Sir Tim Berners-Lee, the inventor of the World Wide Web: “Data-driven journalism is the future.”
But if technology has makes data journalism more accessible, it also makes it increasingly intimidating for newcomers. Because the stack of knowledge no longer involves “only” statistical analysis and design skills, but seemingly, programming, web design and development, algorithms, database administration, application design, user interface and interaction design, data mining and warehousing, and for good measure, operating your own cloud servers. And each of these fields have their own subset of skills, and each of these skills can draw a lifetime of study. And this is before you even apply the journalism part.
It’s true that data journalism, like the questions it seeks to answer, is complicated. But if it could be done before computers, then the fact that we do it now with PCs, EC2 instances, smartphones, and Arduinos, shouldn’t be a barrier to entry.
The goal of small data Journalism is not to uncomplicate data journalism, but to show how to practice data journalism in pieces and small steps – some more technical than others – with the same rationality and ingenuity that we bring to every journalistic endeavor.
The smaller the data, the bigger the story
Good data journalism doesn’t examine just big data, it also seeks out the smallest data, that is, the most discrete and granular bits of information.
Checking your credit card balance annually can tell you that you’re $1,000 more in debt this year than last, but it gives you little insight to why. But check your balance every month, and though the data points are smaller and less significant, when collected throughout the year, you can start answering useful questions: Did the increased spending come during the summer, when you took an overseas vacation? Or during the winter holidays?
Tracking your balance daily allows you to compare your average spending on weekends versus the weekdays: maybe you’ve been going out more since moving to the city. And finally, when collecting the most granular data that your credit card company collects – each transaction, down to the minute and to the recipient – now you can find the answers you need (though you may not like them). Did your increased spending come from necessary categories, like gas or visits to the doctor? Or can it be explained by a recently-developed $5-latté-a-morning habit?
As data journalists, we have the same mindset for public data. A year’s tally of robberies and thefts city-wide is far less revealing than the daily logs that record where and when each incident happen. But with smaller data comes bigger problems: how do you sanely collect this information, and where do you store it? And how do we map it without crashing our users’ web browsers?
Journalism that counts
If you count something you find interesting, you will learn something interesting.
As the data becomes more detailed and numerous, it requires a similar increase of logistics and technical skill. This is what gives data journalism its reputation for being too complicated, as it’s easy to be lost in the details and the techniques.
But all of journalism is complicated: think of the time spent learning how to just write – entire semesters are devoted to proofreading and headline-writing – and the personal skills and studious mindset needed to develop a beat, to read environmental impact reports, to study a line-item budget, to interview an aggrieved parent.
But strip away the writing, the production of the news, the exact process of research and reporting, and what you have in journalism is the core, fundamental act of asking questions.
In data journalism, beneath the technical layers and math, the fundamental action is to count, and the best data journalism involves counting what others couldn’t or didn’t bother to. When struggling with data journalism’s complexity, try approaching it simply as counting.
Five disciplines of data journalism
Data journalism usually brings to mind some kind of statistical analysis and colorful chart. However, those are just specific skills: statistics is just one way to find a story in data and charting is just one way to communicate that story.
My opinion on this changes, and many other journalists might disagree, but I see data journalism as being split into at least five different fields, each of them related to the other but for the most part, distinct in their techniques and purpose.
Here’s my short explanation of the five disciplines using the metaphor of counting.
Reporting: Why should we count this?
This consists of the skills needed in traditional reporting, except with a focus on questioning data as well as people. Experienced reporters see data both as the big picture to the details they’ve learned so far and as a way to discover angles they hadn’t thought of. Reporting also involves knowing who has data, why they keep it, and if they won’t share it, how to convince them to share it.
Analysis: Why is our count different from what’s expected?
This category includes methods of statistical analysis: from means to medians to linear regressions, as well as the ability to calculate the significance and reliability of a data point, and to make correct logical inferences and extrapolations (e.g. correlation is not causation).
Visualization: How do we show what we’ve counted?
Charts and graphs and animated things are the most visible product of data journalism. So it bears repeating that just as traditional journalism isn’t necessarily written, data journalism doesn’t have to be attractive or even visual at all. But when a dataset and its analysis is complex, a narrative approach simply can’t convey the meaning as efficiently as a graphic. Also, making pretty things is a fun obsession.
Collection: Can we please count this any faster?
The best data doesn’t come in a well-maintained spreadsheet. The journalists who are most resourceful in collecting their own data – whether by web-scraping, by hand-built mechanical sensors, or paper and colored pencils – will have a distinct advantage over those who rely on the generosity of the data-keepers.
Curation: Does anyone know where we put what we counted?
Curation is usually associated with museums and aggregating blogs, but here I use it to describe the proper storing and maintenance of data. I include in “Curation” the skills of data cleaning/munging, database design, and the logistics needed for large-scale data processing. I originally combined it with “Collection”, but it’s clearly possible to collect data without knowing how to prepare it for analysis. Curation is probably the least appreciated (and fun) of these disciplines, but understanding it is vital for non-trivial data journalism.
Of course, these fields overlap and interact during the data journalism process: reporting helps inform the collection process, visualization can inspire statistical analysis, statistical methods are used in algorithmic data cleaning, and so forth.
However, when conceiving a data journalism project, I find it helpful to compartmentalize it: thinking of your crime data project as simply an interactive map on the Web is not productive if the quality of the official datasets is so poor or vague that the real work will be in data collection.
Data journalism is a big endeavor, and becoming better at it is a matter of being able to find logical separations of concerns and breaking things down into small steps.
Check the blog or my Twitter for updates. For now, check out a list of readings I’ve compiled and organized (roughly) by the separate disciplines.
About the author
My name is Dan Nguyen and I’ve been a journalist and a programmer at several news organizations. I’m currently Head of Data at Skift, an information and news site for the travel industry. Previously, I was a news application developer at ProPublica, the non-profit investigative newsroom. My largest projects there included Dollars for Docs, SOPA Opera, and the Bailout Tracker.
I’ve taught programming and data journalism workshops for a variety of organizations, including the Investigative Reporters and Editors, the National Institute of Computer-Assisted Reporting, General Assemblyy in New York, the International Journalism Festival, and the Online News Association.
I’ve also written (or still in the process of writing) a few practical how-to online books: The Bastards Books of Ruby, Photography, and Regular Expressions.
My personal blog is at danwin.com and you can find me on Twitter at @dancow.
Technical details
The sdJ site is built using Jekyll, the static-blog generator that powers Github pages, a few notable government sites, and perhaps, most famously, the Obama campaign’s $250 million fundraising platform. Don’t worry, it’s politically-neutral…but the Obama example shows how Jekyll can serve as both a flexible (with a bit of hacking) and low-maintenence publishing platform.
Previously, I’ve used Octopress to build out the Bastards Book of Photography. This time I wanted to see ow far I could get with a few gems and custom plugins. Octopress is still in active development and is a great way to try out Jekyll without having to write so much boilerplate code.
You can see the full Gemfile at the sdJ Github repo. The two Jekyll-specific gems I use are jekyll-assets to allow compilation of SASS and CoffeeScript files and s3_website to deploy sdJ to Amazon S3. Check out Alastair Coote’s excellent explainer of using S3 to cheaply serve up hundreds of thousands of webpages.
The flavor of Markdown I use is Kramdown, which allows for auto-generated table of contents among other nice features that I’m still learning.
Design and layout
Bootstrap 3 has just been released so this was a good time to try it out. However, I ended up keeping just about 1/6th of its code as sdJ keeps mostly to a single-column format, as inspired by 37Signals.
The fonts I use are:
- Arvo for the display and headline fonts
- Droid Serif for the body text
- Helvetica Neue,
font-weight: 300, as the sans-serif font.
The off-white background pattern is from SubtlePatterns, a site that every web-designer should bookmark.
I haven’t coded very many charts yet but I’m planning to use D3 exclusively. It’s my favorite JavaScript charting library and it has the added advantage of creating charts that can be exported as images. For some of the basic charts, I’m using Shuttertock’s Rickshaw wrapper.
Check out the Github repo if you’d like to see the raw code. There’s nothing too fancy in it, but feel free to submit any corrections via git pull
About NYU Data Journalism
This is a five-session course that meets on Monday nights, from 6:45 - 9:15PM. The term starts at September 23 and ends October 21.
The course number is: WRIT1-CE9787
Read more about it on the class homepage.