Welcome to spreadsheet fun.
Table of contents
- Opening thoughts and warmup
- Structured Data
- Practical spreadsheet abilities
- What makes a spreadsheet
- Workshop: Google Spreadsheets
- Homework
- Appendix and Extras
Opening thoughts and warmup
Discussion
For the remainder of the semester, we’ll be looking critically at data analyses. Nearly all such critiques will be a variation of:
“Correlation does not imply causation”
Here’s a humorous introduction to this concept: Correlation or Causation? By Vali Chandrasekaran for BusinessWeek, Dec. 01, 2011.
Review of homework
Last week’s homework question was:
-
Who is the oldest named homicide victim, according to the New York Times data?
-
Create a spreadsheet of ten favorite restaurants in New York
Structured Data
Today’s topic will be the most important – and, unfortunately – the most boring topic we’ll cover: the structure of data. While there are many ways to structure information, as we saw in the Web inspector last week, we’ll limit our scope to: why you should use a spreadsheet for just about everything.
The good news is that it’s easy to learn and will make your data-journalism-aspirations much, much easier.
Nobody believes me, but it’s totally true: In one day – ONE DAY – we can teach you the skills that if mastered would allow you to do 80 percent of all the computer-assisted reporting that has ever been done...I mean, being able to take a dataset, to do some basic count. I mean, this is not rocket science, for the most part. But even most of what I’ve described to you is beyond most reporters in most newsrooms.
Thinking in boxes
Fifty years after 58 cargo containers were shipped by boat, from Newark to Houston, Marc Levinson published “The Box: How the Shipping Container Made the World Smaller and the World Economy Bigger”

Though the engines and power systems that manufactured and moved products were improving drastically in the post-World War 2 era, the bottleneck was in the shipping process. Levinson writes that up to 60 to 75 percent of the cost of shipping cargo was spent on what the ship did at dock – waiting for longshoremen to hand-sort and carry items on and off the boats. A ship could spend as many days loading its cargo and unloading it as it would to cross the Atlantic.
The solution to the high cost of freight handling was obvious: Instead of loading, unloading, shifting, and reloading thousands of loose items, why not put the freight into big boxes and just move the boxes?
While it’s much less interesting than the how things are built and how things are consumed, Levinson argues that the shipping container is a vital part, and cause of the today’s global economy:
What is it about the container that is so important? Surely not the thing itself. A soulless aluminum or steel box held together with welds and rivets, with a wooden floor and two enormous doors at one end: the standard container has all the romance of a tin can. The value of this utilitarian object lies not in what it is, but in how it is used. The container is at the core of a highly automated system for moving goods from anywhere, to anywhere, with a minimum of cost and complication on the way.
It’s OK to think of spreadsheets as the “soulless” part of data journalism, compared to parts where you do reporting and then publish a fancy graphic. But the easier you make the organizing of data, the more time and energy you have for the fun parts.
Practical spreadsheet abilities
Let’s go over the practical features that spreadsheets offer, whether you’re using Excel, Google Spreadsheets, or Google Fusion Tables.
Sortable
Even if you found an efficient way to collect the homicide data used by the New York Times, the data did not come in the order that we need in order to answer the question at hand: “The name of the victim.” If the data were in a spreadsheet, it’d be trivial to find the answer by sorting the columns to our preference.
Crowdsourcable
Last week, I asked you to compile a list of your favorite restaurants. Everyone has a different way of making lists: one person might find it useful to include the category of restaurant – e.g. – Land of Plenty (Chinese) – while another person may omit it when it’s self-evident, e.g. Joe’s Shanghai. There’s different ways of even listing the location: should you include zip code? Or is borough enough?
With a defined spreadsheet structure, there’s less ambiguity and less time spent thinking out those details, no matter how many people are contributing to the data. And immediately, we can already start to sort and count things, even as simple as what boroughs have the best Chinese restaurants.
Interoperable
With well-defined values, we can now connect our data to entirely different data sources with a minimum of fuss. Paste the class list of restaurants into a Google Fusion Table and within seconds, you have an interactive map of favorite restaurants.
The geo-coordinates of places is another data source. Our formalized (and simplified) way of listing restaurant addresses make it easy to link our restaurant data to Google’s geo-coordinate data.
What makes a spreadsheet
Though modern spreadsheet software usually has complicated file formats, data, at its core, is just text.
- Use the Web inspector to see the text behind the data tables of NYU campus crime.
Delimiters
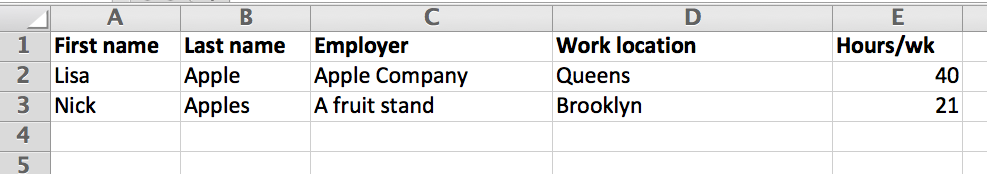
Read these two sentences:
-
The Apple Company, based in Manhattan, hired Lisa Apple for a position at its Queens store at 40 hrs/week.
-
Nick Apples commutes to Brooklyn and spends three hours a day there selling apples from a fruit stand.
For a human, it’s easy to answer questions such as in which borough do Lisa and Nick work and who works more hours a week? But it takes a computer with the natural language processing capabilities of Google or Wolfram Alpha to have even a chance of figuring it out.
What if we, instead, provided the information to the computer in a structured format, like this spreadsheet?
Of course, we don’t provide the computer a spreadsheet. The computer makes a spreadsheet from some kind of defined structure. In an Excel spreadsheet, the computer forces us to enter things into boxes.
But since data is just text, we can also define data’s structure with just text. Here’s the data as comma-separated-values, usually called CSV for short:
First name,Last name,Employer,Work location,Hours/wk
Lisa,Apple,Apple Company,Queens,40
Nick,Apples,A fruit stand,Brooklyn,21
Enter that text into a plain-text editor and save it. Then open it in Excel or Google Spreadsheets. You should see it rendered as if you had entered the data in a spreadsheet to begin with.
With CSVs, we’re saying the data is defined, i.e. delimited by commas.: each comma describes when one column ends and another begins.
You can use anything you want as a delimiter. Here’s the same data, delimited by “pipes”:
First name|Last name|Employer|Work location|Hours/wk
Lisa|Apple|Apple Company|Queens|40
Nick|Apples|A fruit stand|Brooklyn|21
Practice:
- Create our own CSV file from scratch and open it with Excel
- Create a faulty CSV file
Workshop: Google Spreadsheets
We’ll use the NYU campus crime reports to practice collaborative data gathering and analysis.
Collaboration

Each student will pick a URL to work from in this shared Google Spreadsheet.
- Enter your initials in the Initials column
- Visit the URL
- Enter the year and month that the URL corresponds to
- Tally up the crime reports by Category
You can do this via the webpage, but we’ll go over a “trick” to get this data into a spreadsheet. Spreadsheets will help us in two very key ways here:
- Allowing each participant to sort and order their own list as needed to count crimes by category.
- The group spreadsheet makes it easy to compare the month tallies.
Reflections
- What were the problems you faced in just doing a basic count?
- What interesting conclusions can we try to draw from this data. And how valid would those conclusions be?
- How much of a pain would it be if we were to now count crime reports by location, instead of category. How much more painful will it be to provide a report of crimes by category and by location?
Pivot Tables
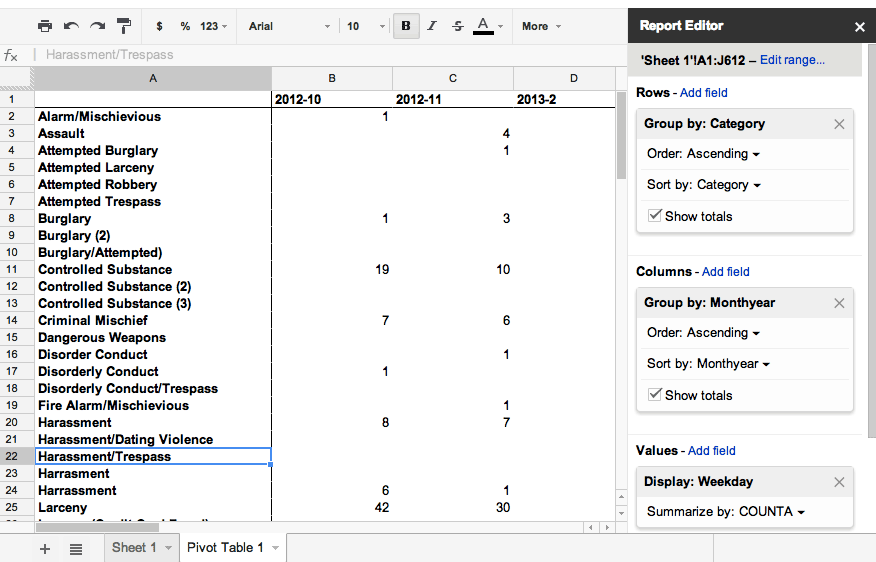
Pivot tables allow us different views into our data. The most obvious use case is to do summaries and counts, just as we tried to do so with the NYU campus crime data.
First, let’s combine our favorite restaurant lists into one. Then let’s think of things we can summarize or count in our data.
Counting restaurants
A demonstration of pivot tables using Borough as a set of Rows to count restaurants per borough.
Averages
Combining Rows and Columns to calculate a simple average.
Formulas
If one data column can be derived from another: such as the Year from a field that contains the entire Date, e.g. 4/7/2015, then we want to use a formula to extract that year value:
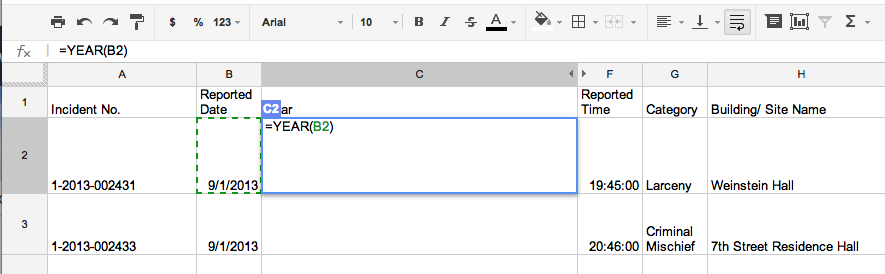
Notice how the equals sign acts as kind of a delimiter, telling the spreadsheet program: the following value here is a formula, not a literal value.
Tasks:
- Create year and month columns for the NYU Crime Campus data
- Use a pivot table to replicate the crowdsourced counting we did earlier
- Extract the day of the week from each date (i.e. Wednesday)
- Use a pivot table to see which days crime reports are most frequent.
Homework
There are four things, explained in detail below:
- Using data files I’ll provide you, use Excel or Google Spreadsheets to answer the specified questions. (Note to actual Fall 2013 class: We didn’t get to Pivot Tables so you can ignore this)
- Explore the NYC data site and find two data sources (or more) that you’d like to link together and try to analyze/visualize. Explain how you anticipate linking the datasets together.
- Read the assigned New York Times article and answer the questions I’ve listed.
- Make an attempt to set up web hosting for yourself. No actual deliverable here, I just want to know if you ran into problems and what those problems were.
More details below.
Practice with spreadsheets
(Short answer)
Using the entire flat file of NYU campus crime data:
- Use a formula to extract hour (0 to 23, in the 24-hour clock format) from the report time. Use Google to find the formula if you can’t guess it off-hand
- Use a pivot table to calculate average crime report rate per hour
Data ideas from NYC Open Data
(Short essay)
Check out the City of New York’s data site, which is essentially a spreadsheet of spreadsheets.
Look through some of the data sets, specifically, what columns they include and the level of detail. Identify two datasets, or more, that you would like to link together and what questions you would aim to answer with such an analysis.
Most importantly, describe how you would be able to join those different datasets together.
Article analysis
(Short answer)
Read this article and answer the following short-answer questions below: Children and Guns: The Hidden Toll, by Michael Luo and Mike McIntire, Sept. 28, 2013
Note: This is an article that deals with a highly emotionally and politically charged topic. As best you can, put aside your gut reaction and viewpoints and examine, and challenge, the data-backed assertions made in the article.
Viewpoints
Let’s narrowly describe the two sides in this debate as:
- Viewpoint A: Believes that the number of accidental child gun deaths justify stronger laws that punish negligent adults and mandates for childproof technology.
- Viewpoint B: Believes that the number of accidental child gun deaths are too insignificant (compared to the overall number of accidental child fatalities) to justify cumbersome technology and laws that may infringe on Second Amendment rights.
Answer these questions in short-answer format:
-
Identify the data sources used by the New York Times to make this statement: “In all, The Times cataloged 259 gun accidents that killed children ages 14 and younger. The youngest was just 9 months old, shot in his crib.”
-
What is the “Hidden Toll” referred to in the headline? i.e. What new interpretation of the data does the New York Times offer that is most relevant to the debate between Viewpoints A and B?
-
How did the Times reach an interpretation different than what has been officially believed?
-
Identify three difficulties in collecting and interpreting the data used for this story.
-
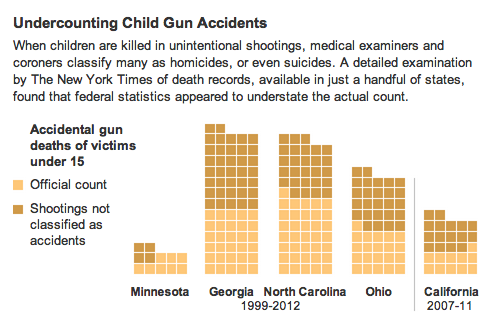
Assuming that the numbers are correct, what statistical questions and objections can Viewpoint B raise in response to this graphic?
-
Assuming that the numbers are correct, what statistical questions and objections can Viewpoint A raise in response to this statement: “Children are “130 percent more likely to die from choking on their dinner” than from accidental shootings.”
-
Viewpoint A might conclude: Based on the New York Times data, accidental child fatality rates in the U.S. are twice what the official statistics show. Is this a reasonable extrapolation? What other factors and data sources would be most important in verifying or challenging that conclusion?
Set up web hosting
(No actual deliverable. Just try it out and report back on any difficulties you have)
For the final project and other homework, I’d like you to publish your data on the web. It’s possible to do this via a blog. But some blog software may not make it easy to embed data charts and visualizations.
So we’ll experiment with the most flexible way of posting Web files: hosting them on a server. Amazon’s Simple Storage Service – S3 for short – provides the easiest and simplest way to do so, though if you have your own web server set up somewhere, feel free to use it.
Don’t worry about having an actual webpage up. I just want you to be familiar with the process and fundamentals (i.e. how is having a file on a web service different than having it on your desktop or sending me an email attachment), which we’ll go over in the next class.
Amazon S3
Note: This requires an Amazon account and a credit card. This does not require you to actually spend any money as basic S3 service is free for a year for new signups, and even when it’s not, you’ll likely spend less than 5 cents a month to have your web files on the Internet (the price is dependent on actual usage, not time). However, if it’s not possible for you to set up an Amazon account (for lack of having a credit card, for instance), please email me and I’ll set up an alternative.
For what it’s worth, the entire smalldatajournalism.com site is hosted on Amazon S3. The actual Amazon S3 address for the homepage is:
http://www.smalldatajournalism.com.s3.amazonaws.com/index.html
Appendix and Extras
In tonight’s class, I had students split up the work of tallying the kinds of crimes that occur on NYU campuses. This was a handy example of how to crowdsource data collection and an illustration of data summarization of flat files.
However, it was also a practical lesson of how much of a pain it is to collect data and that once you get fed up with manual data entry, it’s time to find better ways. Here’s a script I wrote to scrape the NYU crime data sites in about 5 seconds (OK, it took me about 10 minutes to write the script).
About 90% of the code is just comments and printing to screen, because I thought I could do a custom install of Ruby on a NYU lab computer and execute it during class, but I was wrong. It reads this list of URLs from NYU’s Public Safety Dept.
The results of the scrape are here.
1 2 3 4 5 6 7 8 9 10 11 12 13 14 15 16 17 18 19 20 21 22 23 24 25 26 27 28 29 30 31 32 33 34 35 36 37 38 39 40 41 42 43 44 45 46 47 48 49 50 51 52 53 54 55 56 57 58 59 60 61 62 63 64 65 66 67 68 69 70 71 72 73 74 75 76 77 78 79 80 81 82 83 84 85 86 87 88 89 90 91 92 93 94 95 96 97 98 99 100 101 102 103 104 105 106 107 108 | |