Note: It’s past the start date of Sept. 23, 2013. But you’re free to follow the notes and guides on this site as you wish. Also, check out Chrys Wu’s list of other Fall 2013 data journalism classes.
Table of contents
Schedule
Note: This is subject to change depending on class overall technical level and availability of classroom computer lab resources.
Sept. 23 - Introduction to Data Journalism
What makes data journalism different or not from traditional journalism? And as an introduction to how information is structured in our day to day lives, we learn how to use the Web inspector.
Sept. 30 - Introduction to Structured Data
The joy of spreadsheets, including the concept of delimiters, pivot tables, and crowdsourcing data-gathering.
Oct. 7 - Data Mashing
Single-source data is as unreliable as a news story with just one perspective. We’ll learn about the concepts of foreign keys and how to merge different data sets together to find interesting insights.
Oct. 21 - Visualization and Analysis
Keep things simple. Read the class outline
Workshop: Charting and Mapping via Spreadsheets and Google Fusion tables One of the easiest ways to build data-heavy visualizations (step-by-step guide to come)
Oct. 28: Killer Visualizations
- The topic is on how complex visualizations can kill. We will also play around with Open Refine.
- The take-home final can be found here. It is due next week, on Monday, November 4.
- The take-home project is due on November 20. The requirements and description can be found here
Course Description
Name: WRIT1-CE9787, through NYU-SCPS, and part of the Certificate in Digital Journalism.
Date: September 23, 2013 - October 21, 2013
Time: Monday nights, 6:45PM - 9:15PM
Instructor: Dan Nguyen
NYU Class Homepage: Sign-up here.
The rise of personal computing and the Internet has transformed data journalism, long a niche of the newsroom, into one of the most visible fields in today’s media landscape. But while new technologies and techniques have made data journalism more accessible to audiences, they have also made data journalism increasingly intimidating to those who wish to practice it.
This course aims to examine data journalism at its core, through case studies and hands-on practice of modern data skills. Because the course is only five weeks, we focus on the practical concepts and tools needed to explore unfamiliar datasets to find worthwhile stories.
By the end of the course, students will be expected to have the experience and intuition to ask (and, to some degree, answer) these questions:
- Why should anyone care about this data?
- How can I explore, analyze, and compare this data?
- How can I tell the story of this data?
This class will be taught in a small group setting with a focus on hands-on instruction.
Note: I won’t be teaching any programming, but if you already how to code, you’ll learn how to apply it in data journalism. And if you can’t code yet, you’ll learn how it can be useful – which is always good to have in mind before learning to code mid-career.
Prerequisites
- A Google Account with Fusion Tables set up
- Open Refine
- A web browser, preferably Google Chrome
- An Amazon Account with access to AWS S3, or any other public web server
(We’ll go through the installation processes in class, or I’ll have written guides for them.)
Text and Resources
There is no textbook for this class. Here’s a list of recommended online articles and collections relevant to the coursework.
Policies and Academics
Academic Integrity
Plagiarism involves borrowing or using information from other sources without proper and full credit. Students are expected to demonstrate how what they have learned incorporates an understanding of the research and expertise of scholars and other appropriate experts; and thus recognizing others’ published work or teachings – whether that of authors, lecturers, or one’s peers – is a required practice in all academic projects.”
The full policy is located at: http://www.scps.nyu.edu/about-scps/policies-and-procedures/
It will be strictly enforced.
Students with disabilities
New York University is committed to providing equal educational opportunity and participation for students with disabilities. Any student who needs a reasonable accommodation based on a qualified disability is required to register with The Henry and Lucy Moses Center for Students with Disabilities (CSD) for assistance.
Grading Criteria
It’s assumed that students will have a wide range of technical skills and this will greatly impact the scope of work that they can produce for this class. For example, a student experienced in SQL will be able to analyze and chart a dataset involving millions of rows.
But this class will be graded less on technical expertise and more on critical thinking and deductive reasoning. If a student has trouble working with software but can explain in detail how he/she would inspect a real-world dataset, the process for joining other datasets to it, the expected insights from standard analytical methods, and the anticipated pitfalls and inherent limitations of the data, that student would meet this course’s standards.
Grading Components
- 25% – Class Participation/Attendance
- 25% – Quiz/Homework
- 25% – Project
- 25% – Final
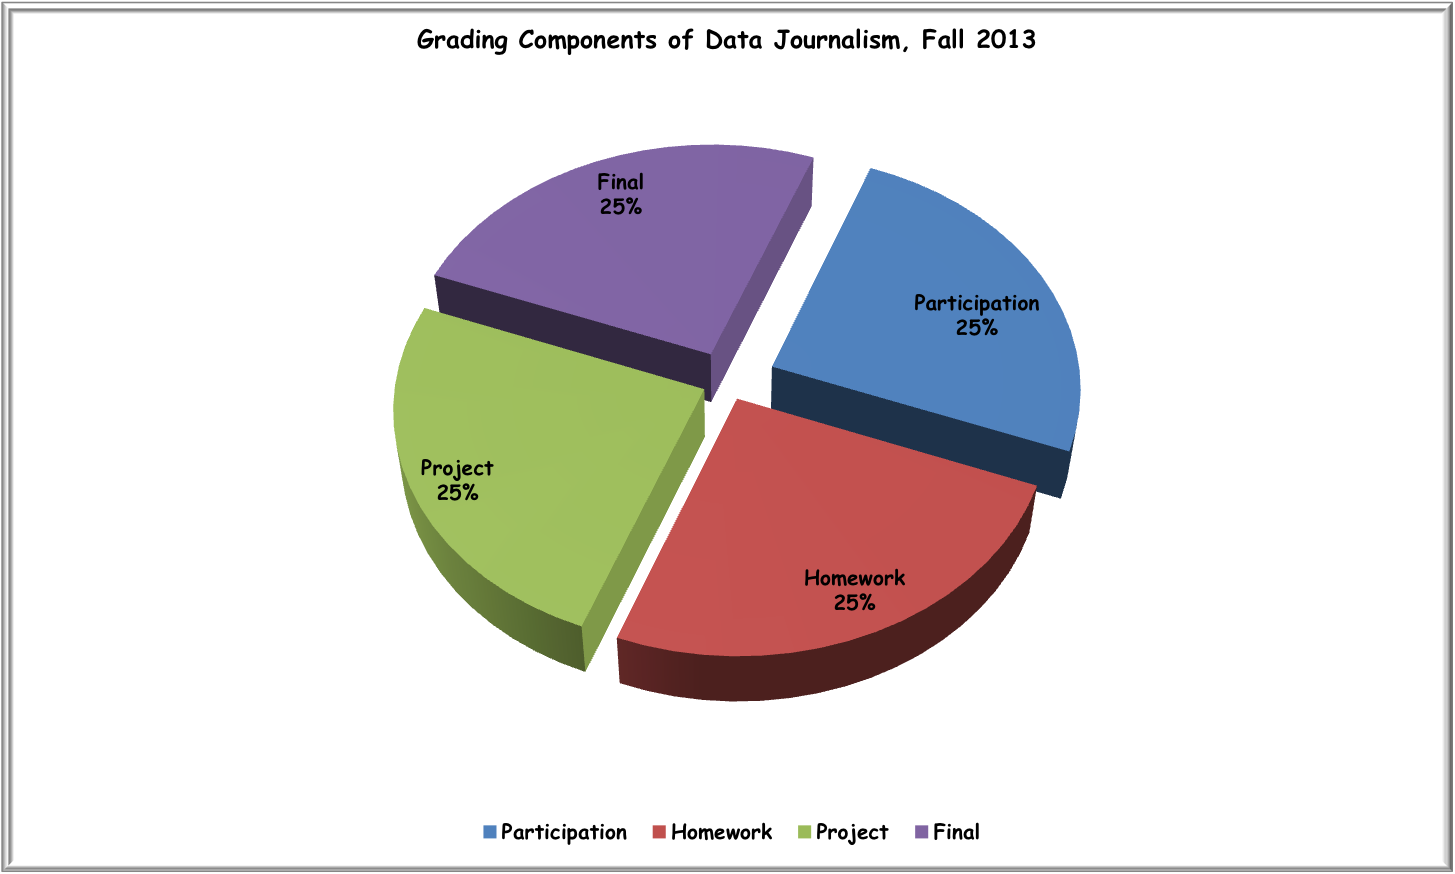
Extra credit: Name five things wrong with the above pie-chart
Other Data Journalism classes
Some of the curriculum and material for this class was inspired or taken from other data journalism classes that have also posted their syllabuses online:
- Analytics and Data Visualization for Journalism, Fall 2013, NYU-SCPS, with Jeremy Singer-Vine
- Data Reporting, Georgetown University, with Derek Willis
- Data-Driven Journalism, CUNY Graduate School of Journalism, with Russell Chun and Amanda Hickman
- Data Journalism at SHERP, NYU, with Amanda Cox and Kevin Quealy.
- JOMC 491.7: Data Driven Journalism, UNC, with Ryan Thornburg
- Computer-Assisted Reporting, Fall 2013 , Mizzou, with David Herzog
- Communication 217/117: Digital Journalism, Winter 2013, Stanford, with R.B. Brenner